Apache Superset – A Powerful BI Tool
- General
Apache Superset – A Powerful BI Tool
This Blog will focus on Apache Superset, an open-source business intelligence tool for data collection, exploration, and visualization. It is easy to use, faster and more efficient than existing similar tools. It has various features to visualize and explore data. It provides SQL queries (easily manageable) to process data in simple forms. This blog explains the functionality, advantages, and setup of the Apache superset as well as connectivity with the database and an informational Dashboard including graphs, tables, and charts with a simple example.
What is Apache Superset?
Suppose you have a lot of data and you have to analyze that data, You can analyze your data through visualization and exploration. Then Apache superset becomes a handful for data analysis. It’s a tool that can easily analyze your data and visualize it in the form of charts, tables, and graphs. It is easy to configure and manage. It has various functions to explore and visualize data through simple queries, all you have to select the function and run those queries. That’s why it’s the most popular BI tool, you might have heard of some similar tools like PowerBI, and Tableau but apache superset as compared to those tools is very easy to configure and it supports various functionality which is quite easy to the plugin. Another reason for its popularity is that It can be easily adopted by people who are not much technical. A basic understanding of SQL might be helpful for using this open-source tool.
Apache Superset Features
- Data Visualization
- Data Exploration
- Data Analysis
- UI/Dashboard
- Time Series Data
- Authentication / Authorization
- Integration with various Databases
How does Apache Superset help with Data visualization and exploration?
Data exploration involves taking a deeper look at the data to understand the structure, features, and relationships. It requires a closer look into the data beyond the general structure. Once you explored the data you want to visualize your data in the form of tables, charts, and graphs. Data visualization is the process of representing data in a visual format. Apache Superset provides the functionality of visualization of your data which is stored in your database. It provides an interactive dashboard interface that includes charts, tables maps, and graphs through which your data can be easily rendered. You can easily create those charts by running simple queries. Data Analysis becomes easy once the data is converted into a visual format, we can easily analyze the transition, trends, and patterns of data. It also provides Time-series data for visualization.
Installation of Apache Superset
There are a few steps for installing Apache Superset in your system. I’m using Ubuntu
1. Dependency installation
Use this command to install all required dependencies in your system. (My system has Ubuntu 20.04)
|
1 |
sudo apt-get install build-essential libssl-dev libffi-dev python3-dev python3-pip libsasl2-dev libldap2-dev default-libmysqlclient-dev |
2. Create a virtual environment and activation
It’s recommended that Apache superset should install in a virtual environment. for creating a virtual environment use this command :
|
1 2 |
pip install virtualenv python3 -m venv superset-venv |
for the active virtual environment :
|
1 |
. superset-venv/bin/activate |
After activating the virtual environment all packages will install in this environment. For deactivating use deactivate command.
3. Installing superset
Once you activate the virtual environment, we install the apache superset.
|
1 |
pip install apache-superset |
It may take some time depending on your system to install all packages.
4. Initializing database
To initialize database
|
1 |
superset db upgrade |
If you’re having trouble or getting errors make sure you installed the right packages. In my case, I used these commands to resolve all errors.
|
1 2 3 4 |
python3 -m pip install Flask-WTF==0.14.3 pip install pysocks pip install 'urllib3[secure]' pip install markupsafe==2.0.1 |
5. Create default role and permission
We need to create a default role and permissions in our database.
|
1 |
superset init |
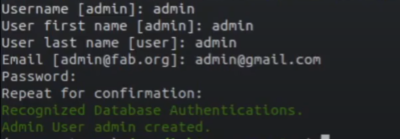
6. Create an admin user and load Examples
Add an Admin User and if you need some samples you can load examples.
|
1 2 |
superset fab create-admin superset load-examples |
7. Running superset
To start a development web server on port 8088.
|
1 |
superset run -p 8088 --with-threads --reload --debugger |
If everything worked you can navigate to http://127.0.0.1:8088/
Now you can log in with the same credential you’ve entered before.
Welcome Screen will look like this.

Connecting with Database
Superset can query data from any SQL-speaking datastore that has a Python DB-API driver and an SQLAlchemy dialect. Superset provides the default database Postgres, you can use it, or if you want to add some other database you can follow these steps.

1. Install Database Driver
Identify your database for example I’m taking MYSQL.
First, check all required dependencies and install the database driver.
|
1 2 |
sudo apt-get install python3-dev default-libmysqlclient-dev build-essential pip install mysqlclient |
2. Connect to the Database
i. Click the + database icon on the display in the right top corner.

ii. Choose the database you want to work on.

iii. Fill Display name and URI( for MYSQL it will be mysql+pymysql://username:password@{host}/{db_name})

before connecting the database, first test the connection to confirm if things function seamlessly from end to end. If the connection looks good, you can go ahead and save the configuration by connecting button. With this, you have successfully added a new database.
If everything is right your Database display will look like this.

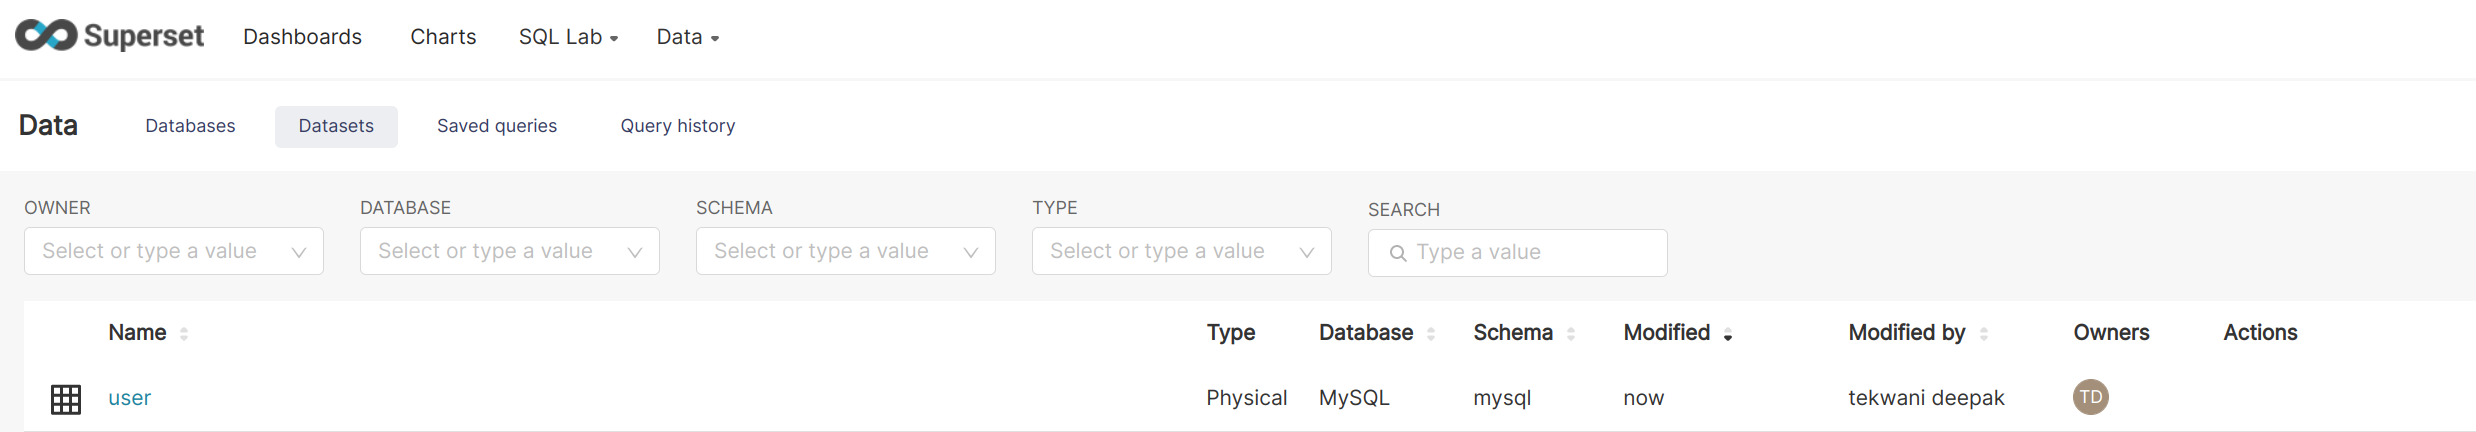
In Database, you can create datasets by existing tables. All you have to select create dataset option and select the database.
Setup A Dashboard in Apache Superset
To set up the dashboard we need to connect with the required database. From the database, we will create datasets(tables). Charts and tables(A visualized form of Data) will be created by providing data from datasets and running specific queries.
1. Connect with Database as your requirement
I’ve already described how to connect a specific database.
2. Create Datasets from a particular database
i) Click on Data button on the home screen and select dataset.
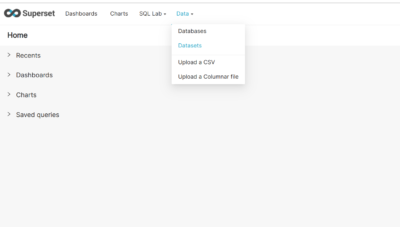
ii). Click on +Dataset button
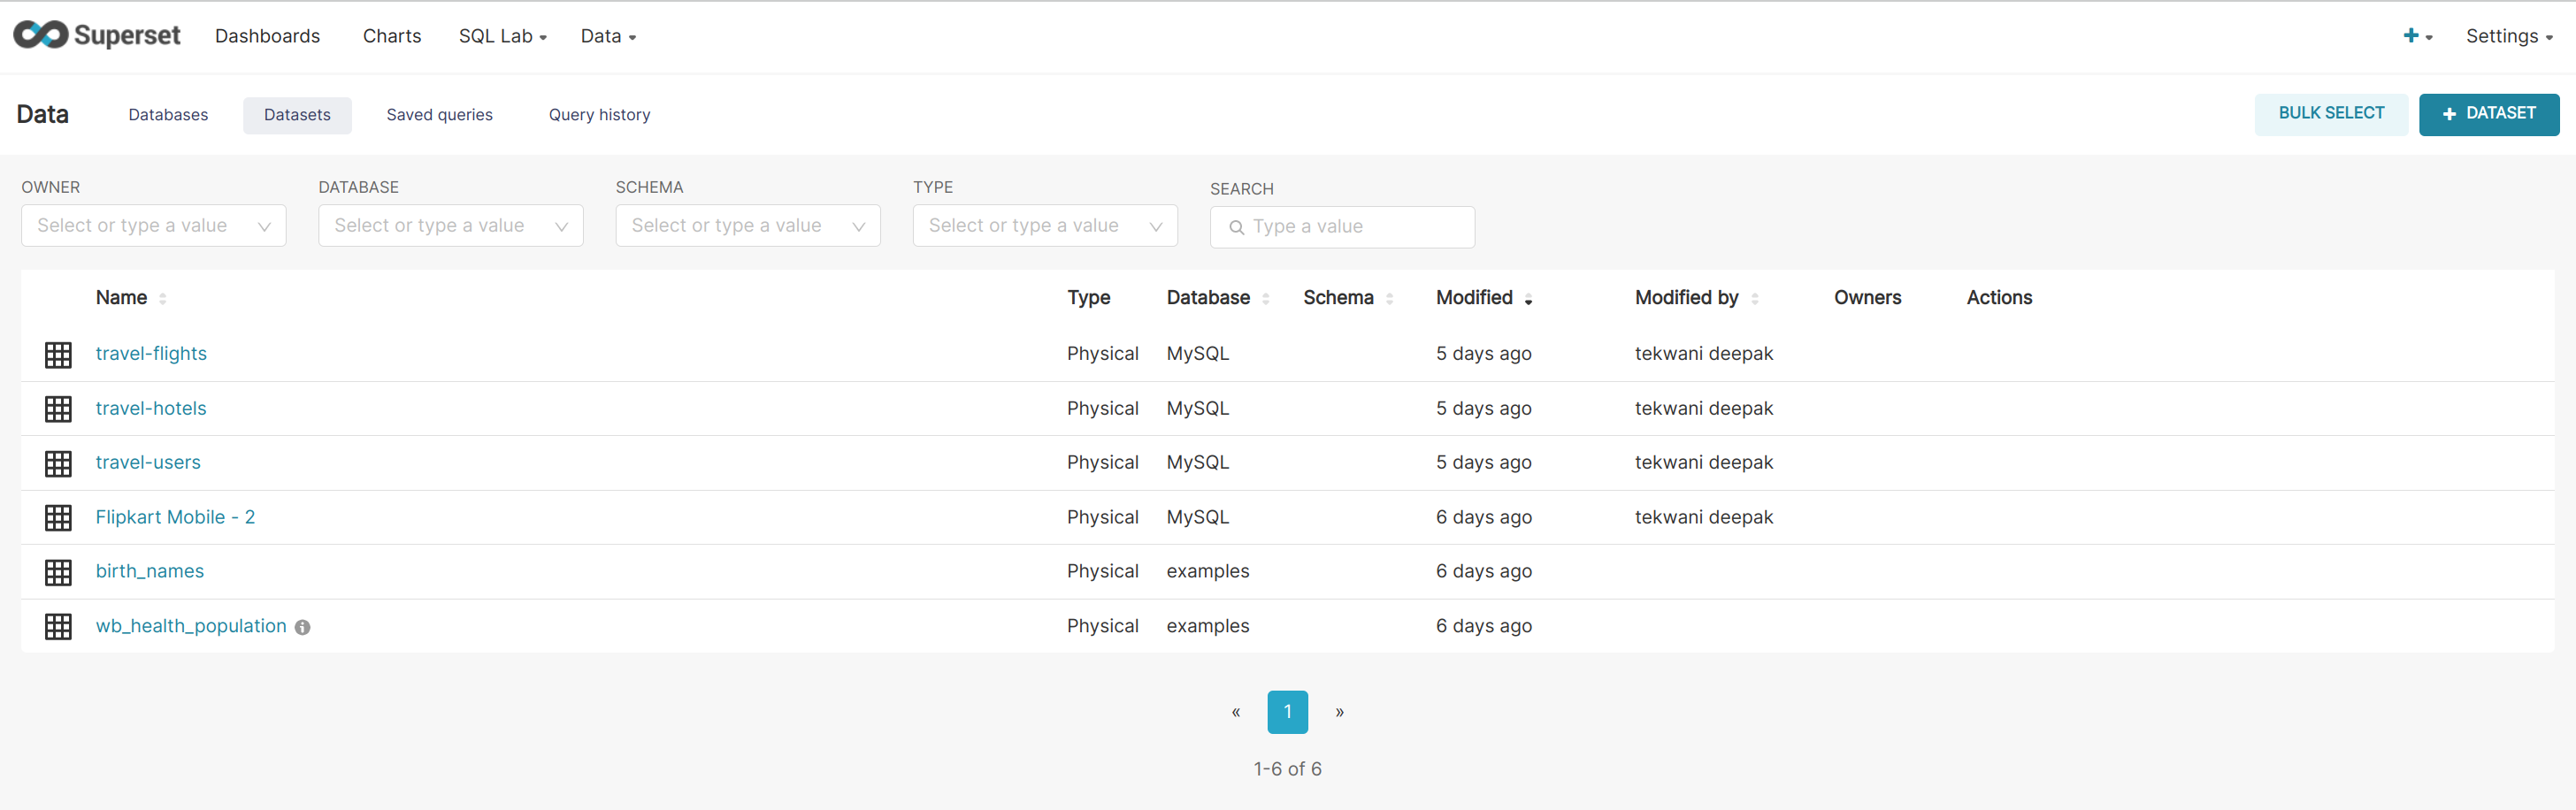
iii). Select the Database, Schema, and Table.

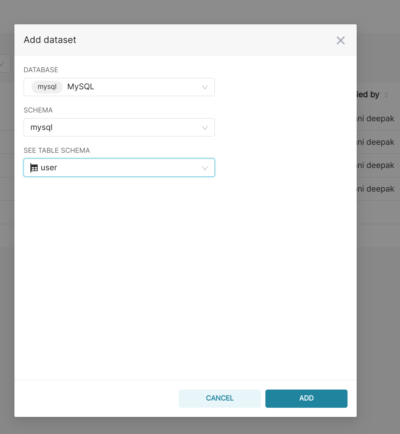
iv). Add dataset and proceed ahead.
3. Create charts, tables, and graphs by using data and running queries.
Go to the home screen and select charts. You’ll see a lot of prepared charts(Examples by Apache superset).

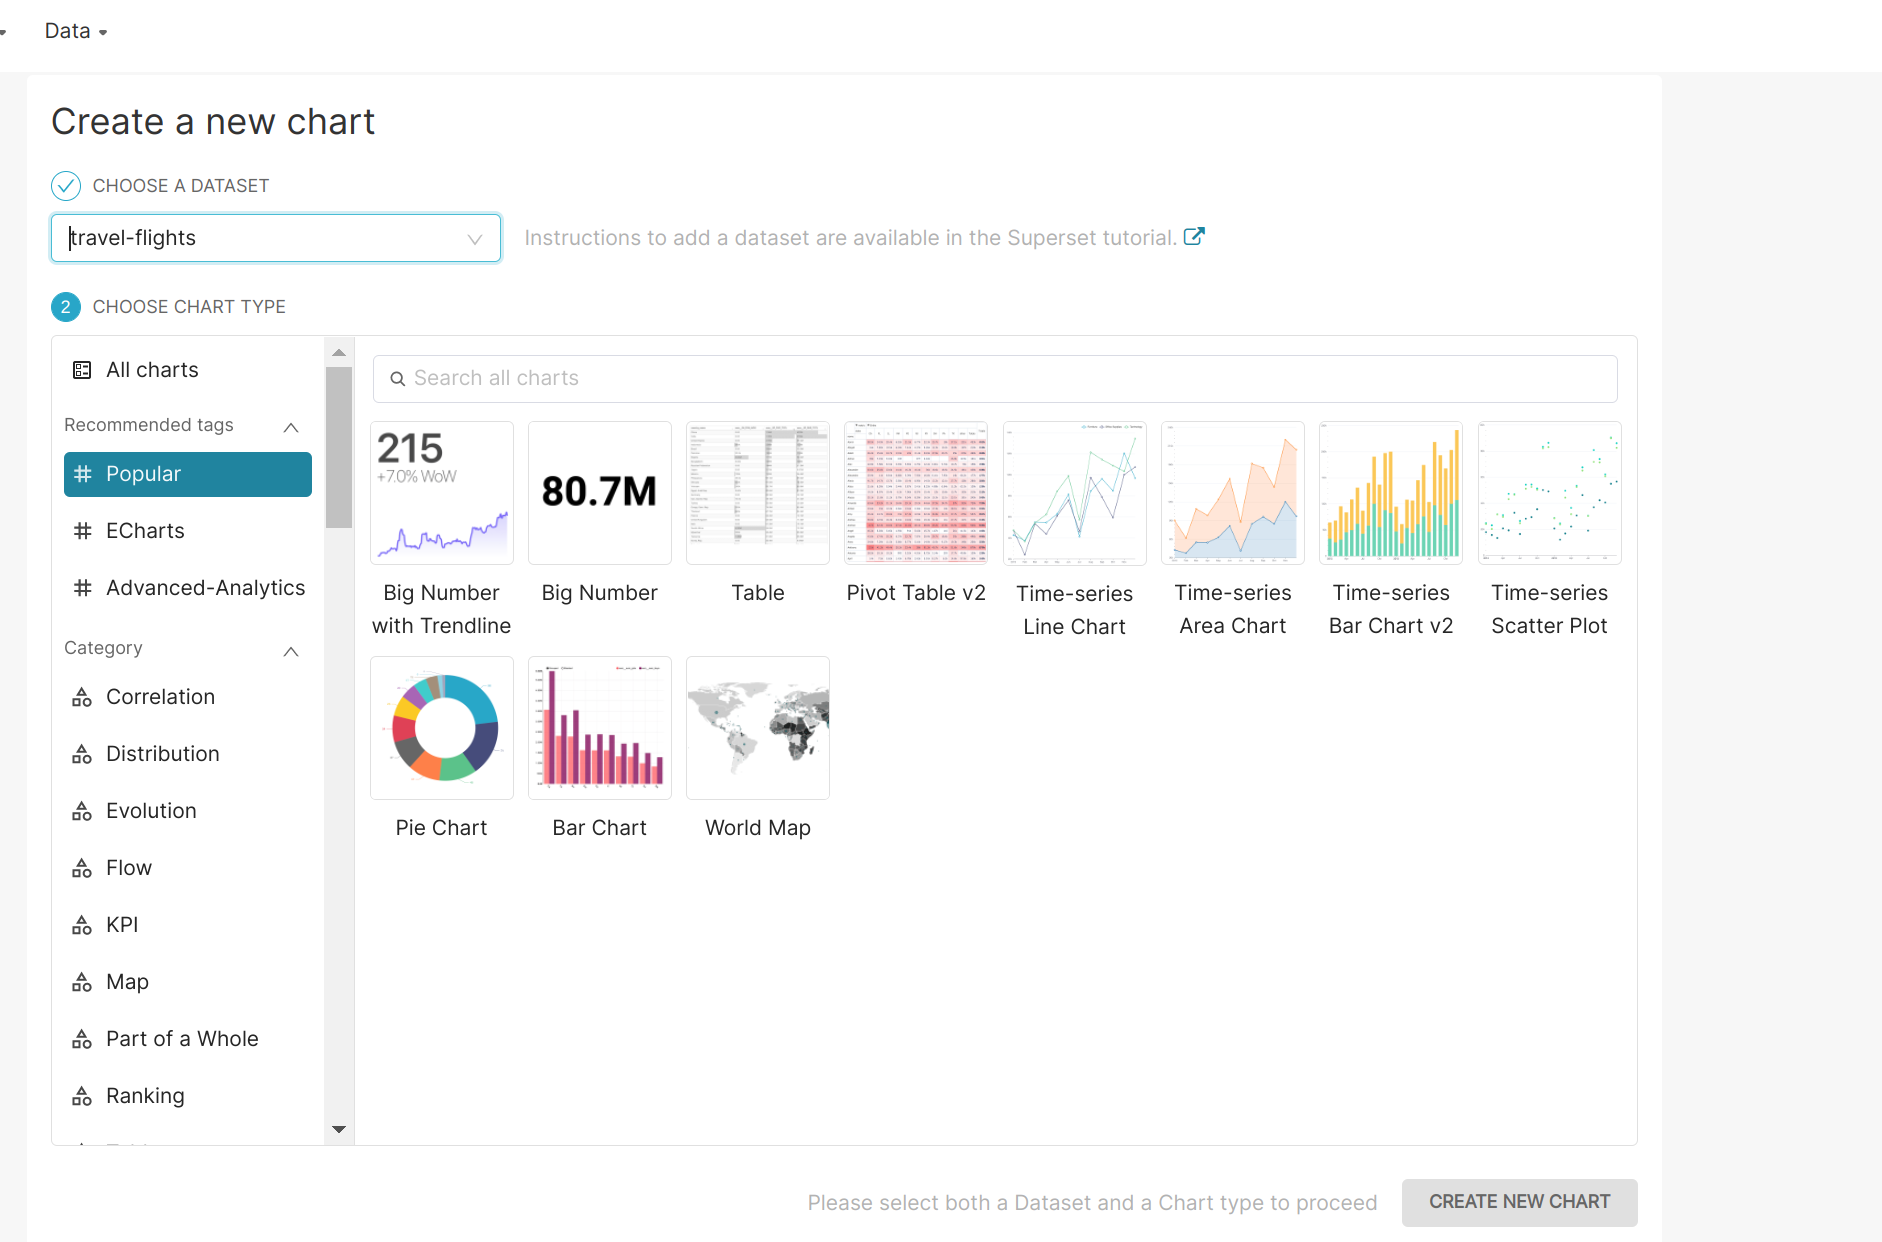
If you want to create a chart, click on the +chart button and choose a database.
After selecting the database you can select charts as your need.
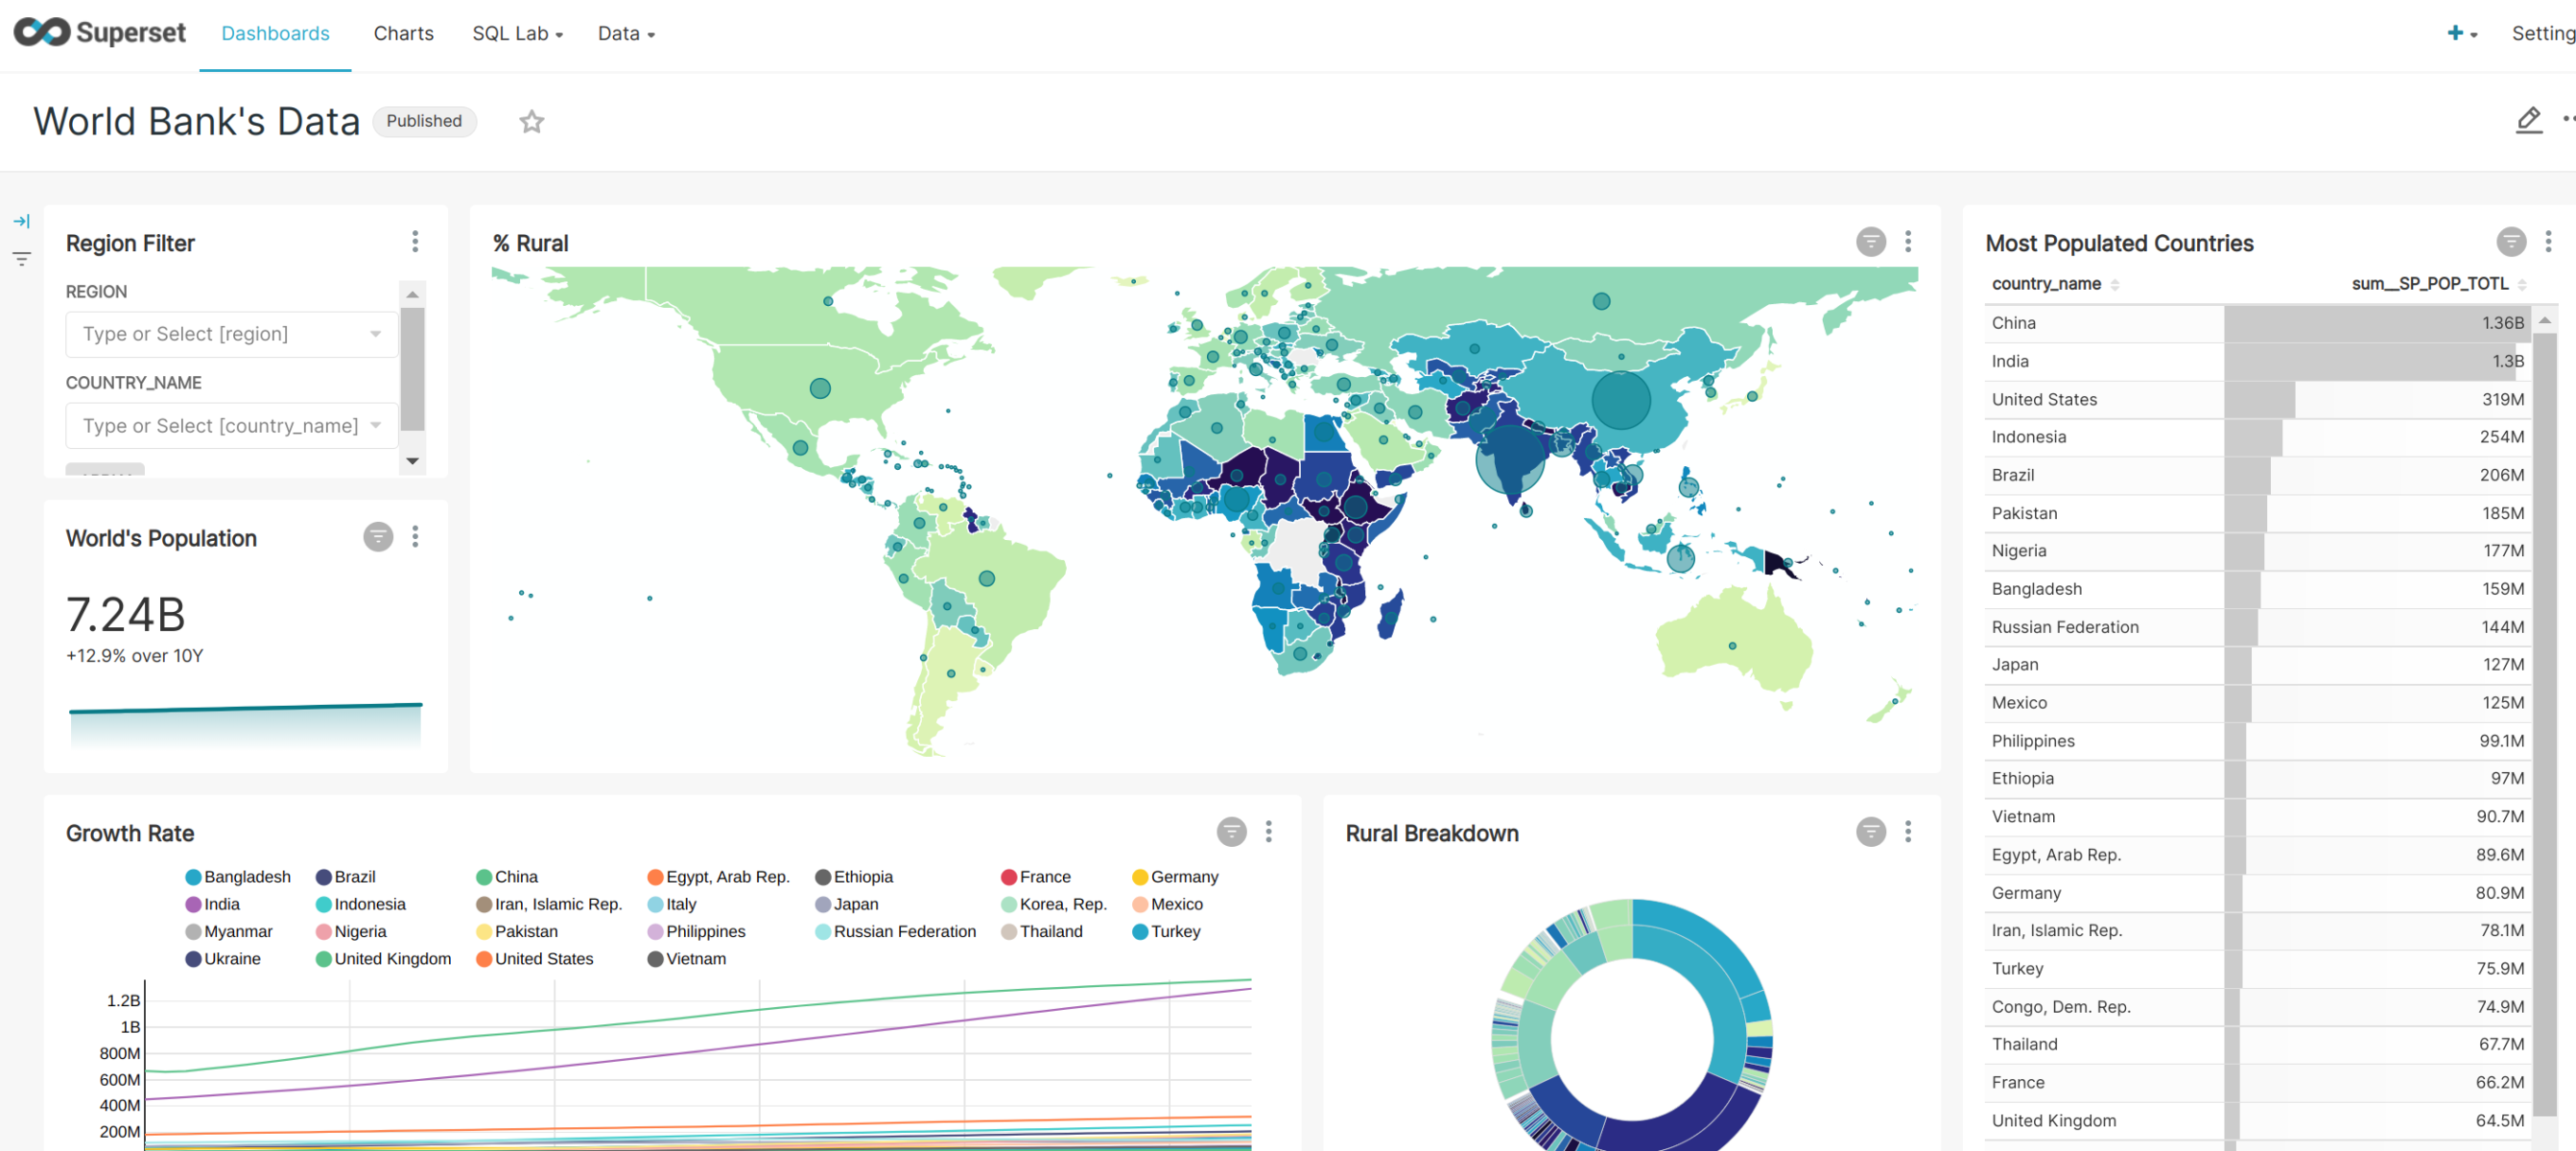
4. Create a Dashboard
Click on +Dashboard and create a new one.
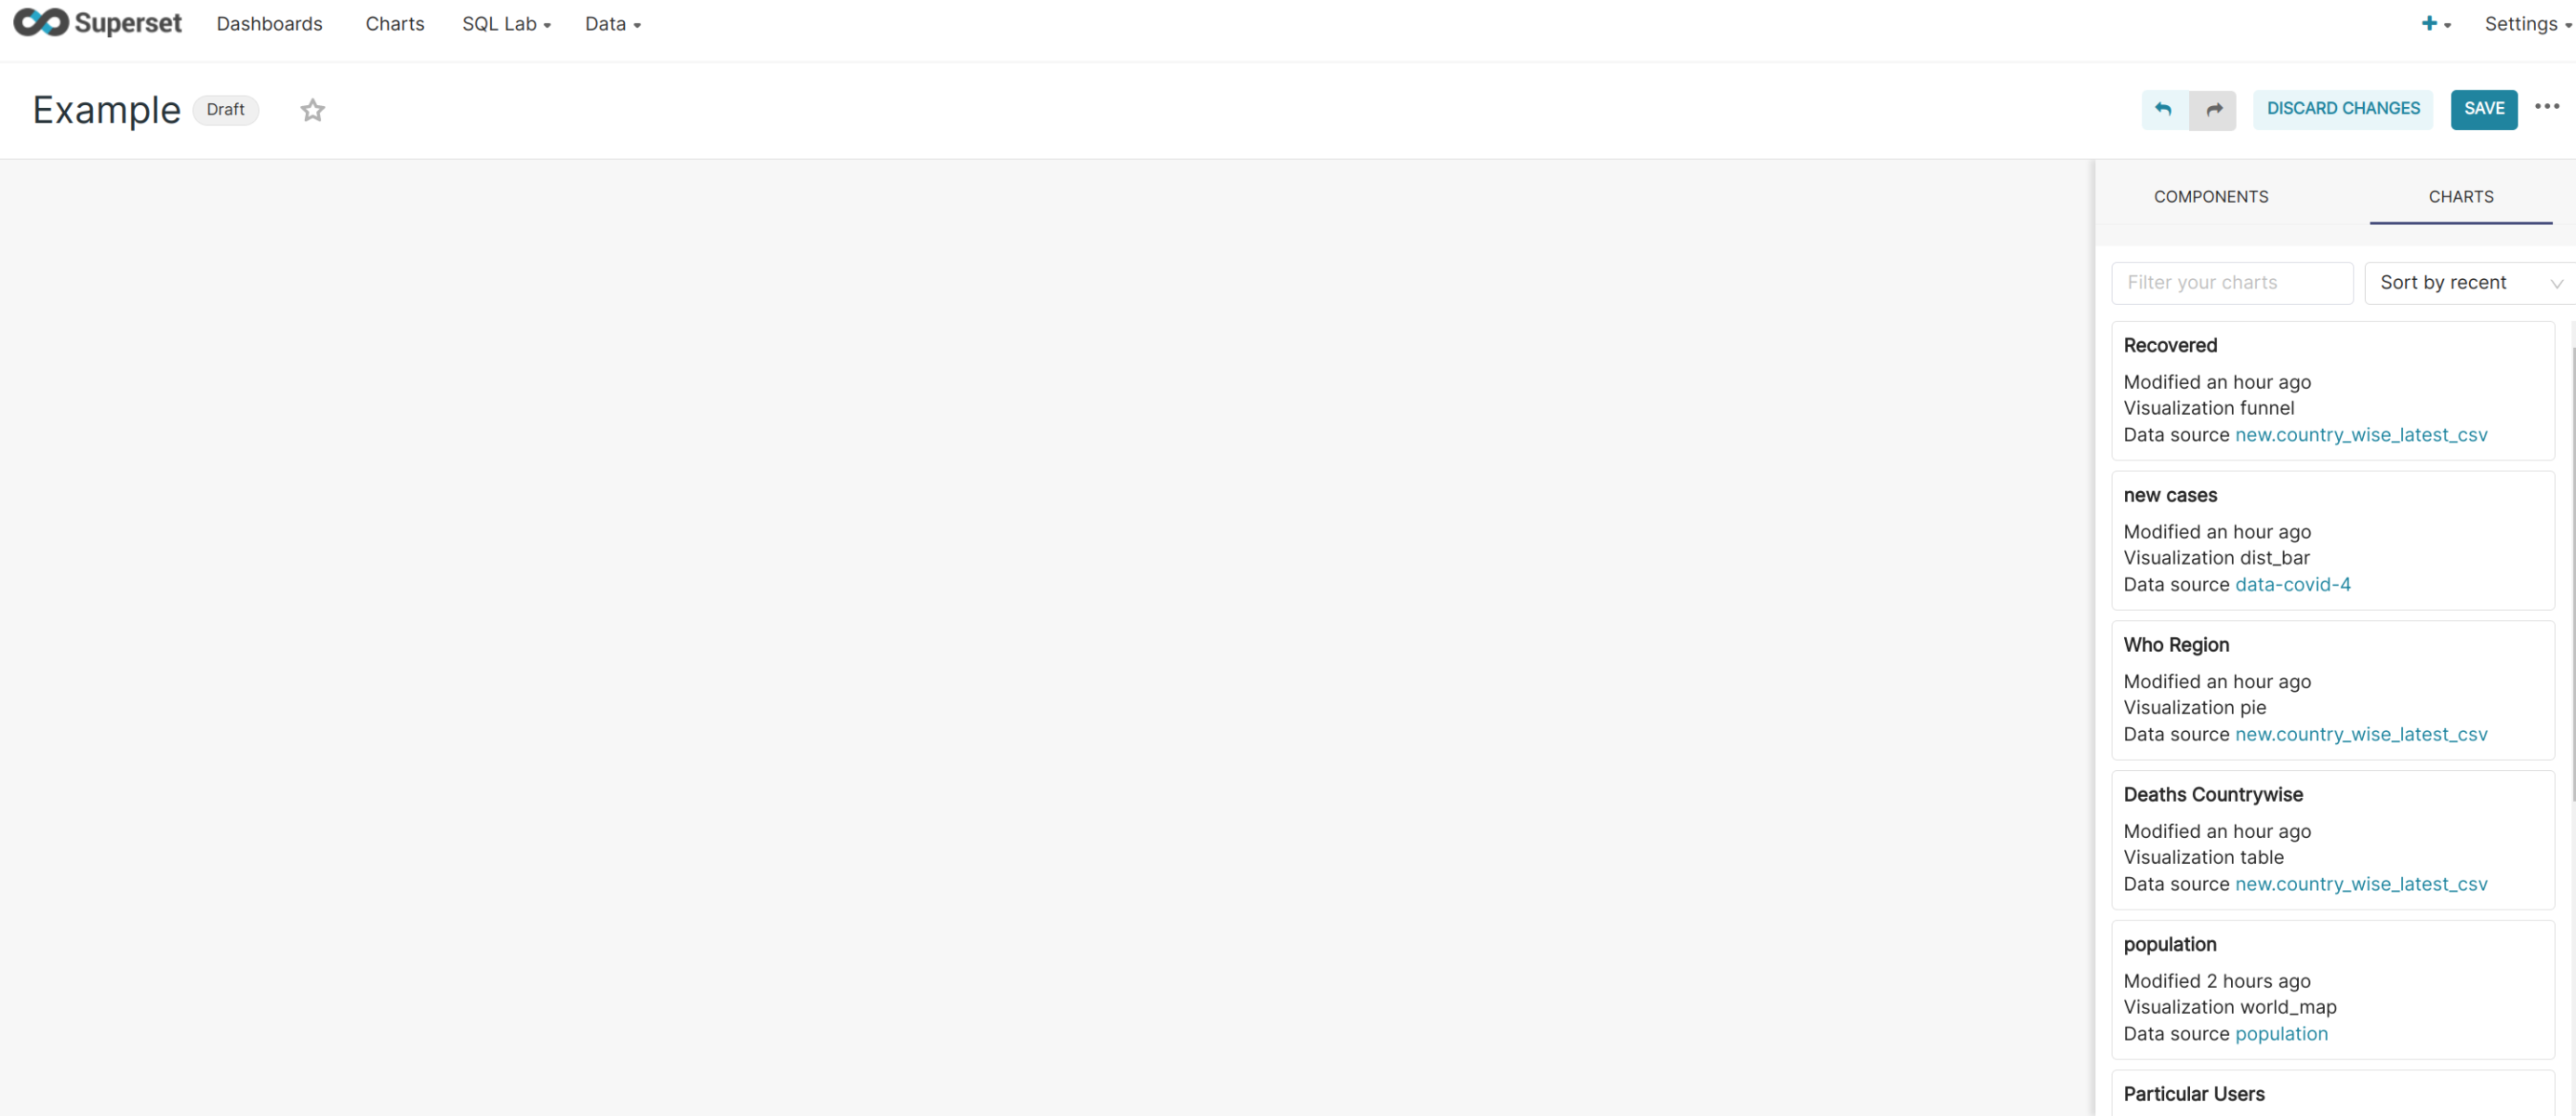
You’ll see existing charts, you can simply drag and drop them on the dashboard.
Conclusion
Apache superset is an open-source BI tool having various functions and features. You can easily operate and process data and charts as well as you can download visuals like images and processed data in tabular and CSV format. It is more user-friendly than existing BI tools. It has a simple interface though it is capable of excessing data and visualization.