Using AWS CloudWatch for spring boot project metrics
Using AWS CloudWatch for spring boot project metrics
In this blog, we will discuss how to use AWS CloudWatch to monitor a Spring Boot application running on AWS. Specifically, we’ll cover the following topics:
- Setting up a Spring Boot application
- Creating custom metrics with Micrometer and AWS
- Checking metrics on CloudWatch
- Setting up alarms and notifications
Setting up a Spring Boot application and AWS
Create a Spring Project from start.spring.io with the spring-boot-starter-web dependency and download the zip file. Now we will create an IAM user at AWS to access Cloudwatch from our spring application.
- Log in to your AWS Management Console and navigate to the IAM service.
- Click on the “Users” link in the left-hand navigation menu and then click the “Add user” button.
- Enter a name for the new user and select the “Programmatic access” checkbox. This will generate an access key and secret key that the user can use to access AWS services programmatically.
- Click the “Next: Permissions” button.
- On the permissions screen, click the “Attach existing policies directly” button.
- Search for the policy named “CloudWatchFullAccess” and select it by clicking the checkbox next to it.
- Click the “Next: Tags” button and add any relevant tags to the user if desired.
- Click the “Next: Review” button to review the details of the new user.
- Review the information and click the “Create user” button to create the user.
After creating the user, the final confirmation screen will display their access key and secret key. Make sure to securely save these keys as they will not be displayed again. You can use these keys to access CloudWatch from our spring boot application.
Creating custom metrics with Micrometer
Now that our application is running on AWS, we need to start monitoring it. One way to do this is to use Micrometer.
Micrometer is a metrics collection library for Java-based applications. It provides a simple and flexible way to instrument code and gather metrics on a variety of systems and applications that integrates with popular monitoring systems, including CloudWatch.
Micrometer offers different meters to measure various aspects of an application’s performance, including:
- Counter: It increments only and can count events or keep track of the number of times something has happened.
- Gauge: It measures the current value of a particular variable, such as the number of active threads in a thread pool.
- Timer: It measures the duration of an operation, such as the time it takes to execute a particular method.
- Long Task Timer: It measures the duration of long-running tasks, such as database queries or network calls.
- Histogram: It measures the distribution of values for a particular metric over time.
- Distribution Summary: It tracks the distribution of values for a particular metric, similar to a histogram.
To use Micrometer in our Spring Boot application, we first need to add the following dependency to our pom.xml file:
|
1 2 3 4 5 6 7 8 |
<dependency> <groupId>io.micrometer</groupId> <artifactId>micrometer-core</artifactId> </dependency> <dependency> <groupId>io.micrometer</groupId> <artifactId>micrometer-registry-cloudwatch2</artifactId> </dependency> |
In this blog, we will use the Counter, Gauge, and Timer meter. We will create an application where we will track the number of requests received on a particular endpoint using a Counter Meter, the time taken to complete a particular request using a Timer Meter, and the price change of a product using a Guage Meter.
1. App Config
|
1 2 3 4 5 6 7 8 9 10 11 12 13 14 15 16 17 18 19 20 21 22 23 24 25 26 27 28 29 30 31 32 33 34 35 36 37 38 39 40 41 42 43 44 |
@Bean public CloudWatchAsyncClient cloudWatchAsyncClient() { return CloudWatchAsyncClient.builder() .region(REGION) .credentialsProvider( StaticCredentialsProvider.create(new AwsCredentials() { @Override public String accessKeyId() { return awsAccessKey; } @Override public String secretAccessKey() { return awsSecretKey; } }) ) .build(); } @Bean public MeterRegistry getMeterRegistry() { CloudWatchConfig cloudWatchConfig = setupCloudWatchConfig(); MeterRegistry meterRegistry = new CloudWatchMeterRegistry(cloudWatchConfig, Clock.SYSTEM, cloudWatchAsyncClient()); return meterRegistry; } private CloudWatchConfig setupCloudWatchConfig() { CloudWatchConfig cloudWatchConfig = new CloudWatchConfig() { private Map<String, String> configuration = Map.of("cloudwatch.namespace", "productsApp", "cloudwatch.step", Duration.ofMinutes(1).toString()); @Override public String get(String key) { return configuration.get(key); } }; return cloudWatchConfig; } |
The cloudWatchAsyncClient() method returns an instance of CloudWatchAsyncClient which is a client that can asynchronously interact with the CloudWatch service in AWS. It is constructed using the builder() method, which sets some properties like the region where the client will be used and the credentials provider. The credentials provider is defined using the StaticCredentialsProvider.create() method and provides the AWS access key and secret key needed to authenticate with the CloudWatch service.
The getMeterRegistry() method returns an instance of MeterRegistry, which is an interface that provides a way to collect and record application metrics. The CloudWatchConfig object is set up using the setupCloudWatchConfig() method. The CloudWatchMeterRegistry is then created with the CloudWatchConfig object, a Clock instance, and the CloudWatchAsyncClient.
The setupCloudWatchConfig() method sets up the configuration for the CloudWatch client. It sets the namespace for the metrics to be “productsApp” and the interval at which metrics should be sent to CloudWatch to be 1 minute.
2. Price Engine
|
1 2 3 4 5 6 7 8 9 10 11 12 13 14 15 16 17 18 19 20 |
@Service public class PricingEngine { private Double price; public Double getProductPrice() { return price; } @Scheduled(fixedRate = 60000) public void computePrice() { Random random = new Random(); price = random.nextDouble() * 100; System.out.println("computing price "+price); } } |
The computePrice() method is annotated with the @Scheduled annotation, which indicates that it should be executed every 60 seconds. This method generates a random price using the Random class and assigns it to the price variable.
3. Product Controller
|
1 2 3 4 5 6 7 8 9 10 11 12 13 14 15 16 17 18 19 20 21 22 23 24 25 26 27 28 29 30 31 32 33 34 35 36 37 38 39 40 41 42 43 44 45 46 47 48 49 |
public class ProductController { private Counter pageViewsCounter; private Timer productTimer; private Gauge priceGauge; private MeterRegistry meterRegistry; private PricingEngine pricingEngine; @Autowired ProductController(MeterRegistry meterRegistry, PricingEngine pricingEngine){ this.meterRegistry = meterRegistry; this.pricingEngine = pricingEngine; priceGauge = Gauge .builder("product.price", pricingEngine , (pe)->{return pe != null? pe.getProductPrice() : null;}) .description("Product price") .baseUnit("ms") .register(meterRegistry); pageViewsCounter = meterRegistry .counter("PAGE_VIEWS.ProductList"); productTimer = meterRegistry .timer("execution.time.fetchProducts"); } @GetMapping("/products") public List<Product> fetchProducts() { long startTime = System.currentTimeMillis(); List<Product> products = fetchProductsFromDB(); // increment page views counter pageViewsCounter.increment(); // record time to execute the method System.out.println("productTimer "+productTimer + " " + pageViewsCounter + " " + priceGauge); productTimer.record(Duration.ofMillis(System.currentTimeMillis() - startTime)); return products; } } |
The @GetMapping annotation annotates the fetchProducts() method to handle HTTP GET requests to the /products endpoint. It fetches a list of products from a database, increments the pageViewsCounter, and records the time taken to execute the method using the productTimer.
To set up the priceGauge, Gauge.builder() method is used to create a gauge metric that records the current price of the product. A lambda function is built to return the product price obtained from the PricingEngine. The metric’s description and baseUnit are provided using the description and baseUnit methods, respectively. The register method is used to register the gauge metric with the meterRegistry.
To set up the pageViewsCounter, the meterRegistry.counter() method creates a counter metric that records the number of page views for the /products endpoint.
To set up the productTimer, the meterRegistry.timer() method creates a timer metric that records the time taken to execute the fetchProducts() method.
3. Checking metrics on AWS CloudWatch
To check a metrics on AWS CloudWatch, you can follow these steps:
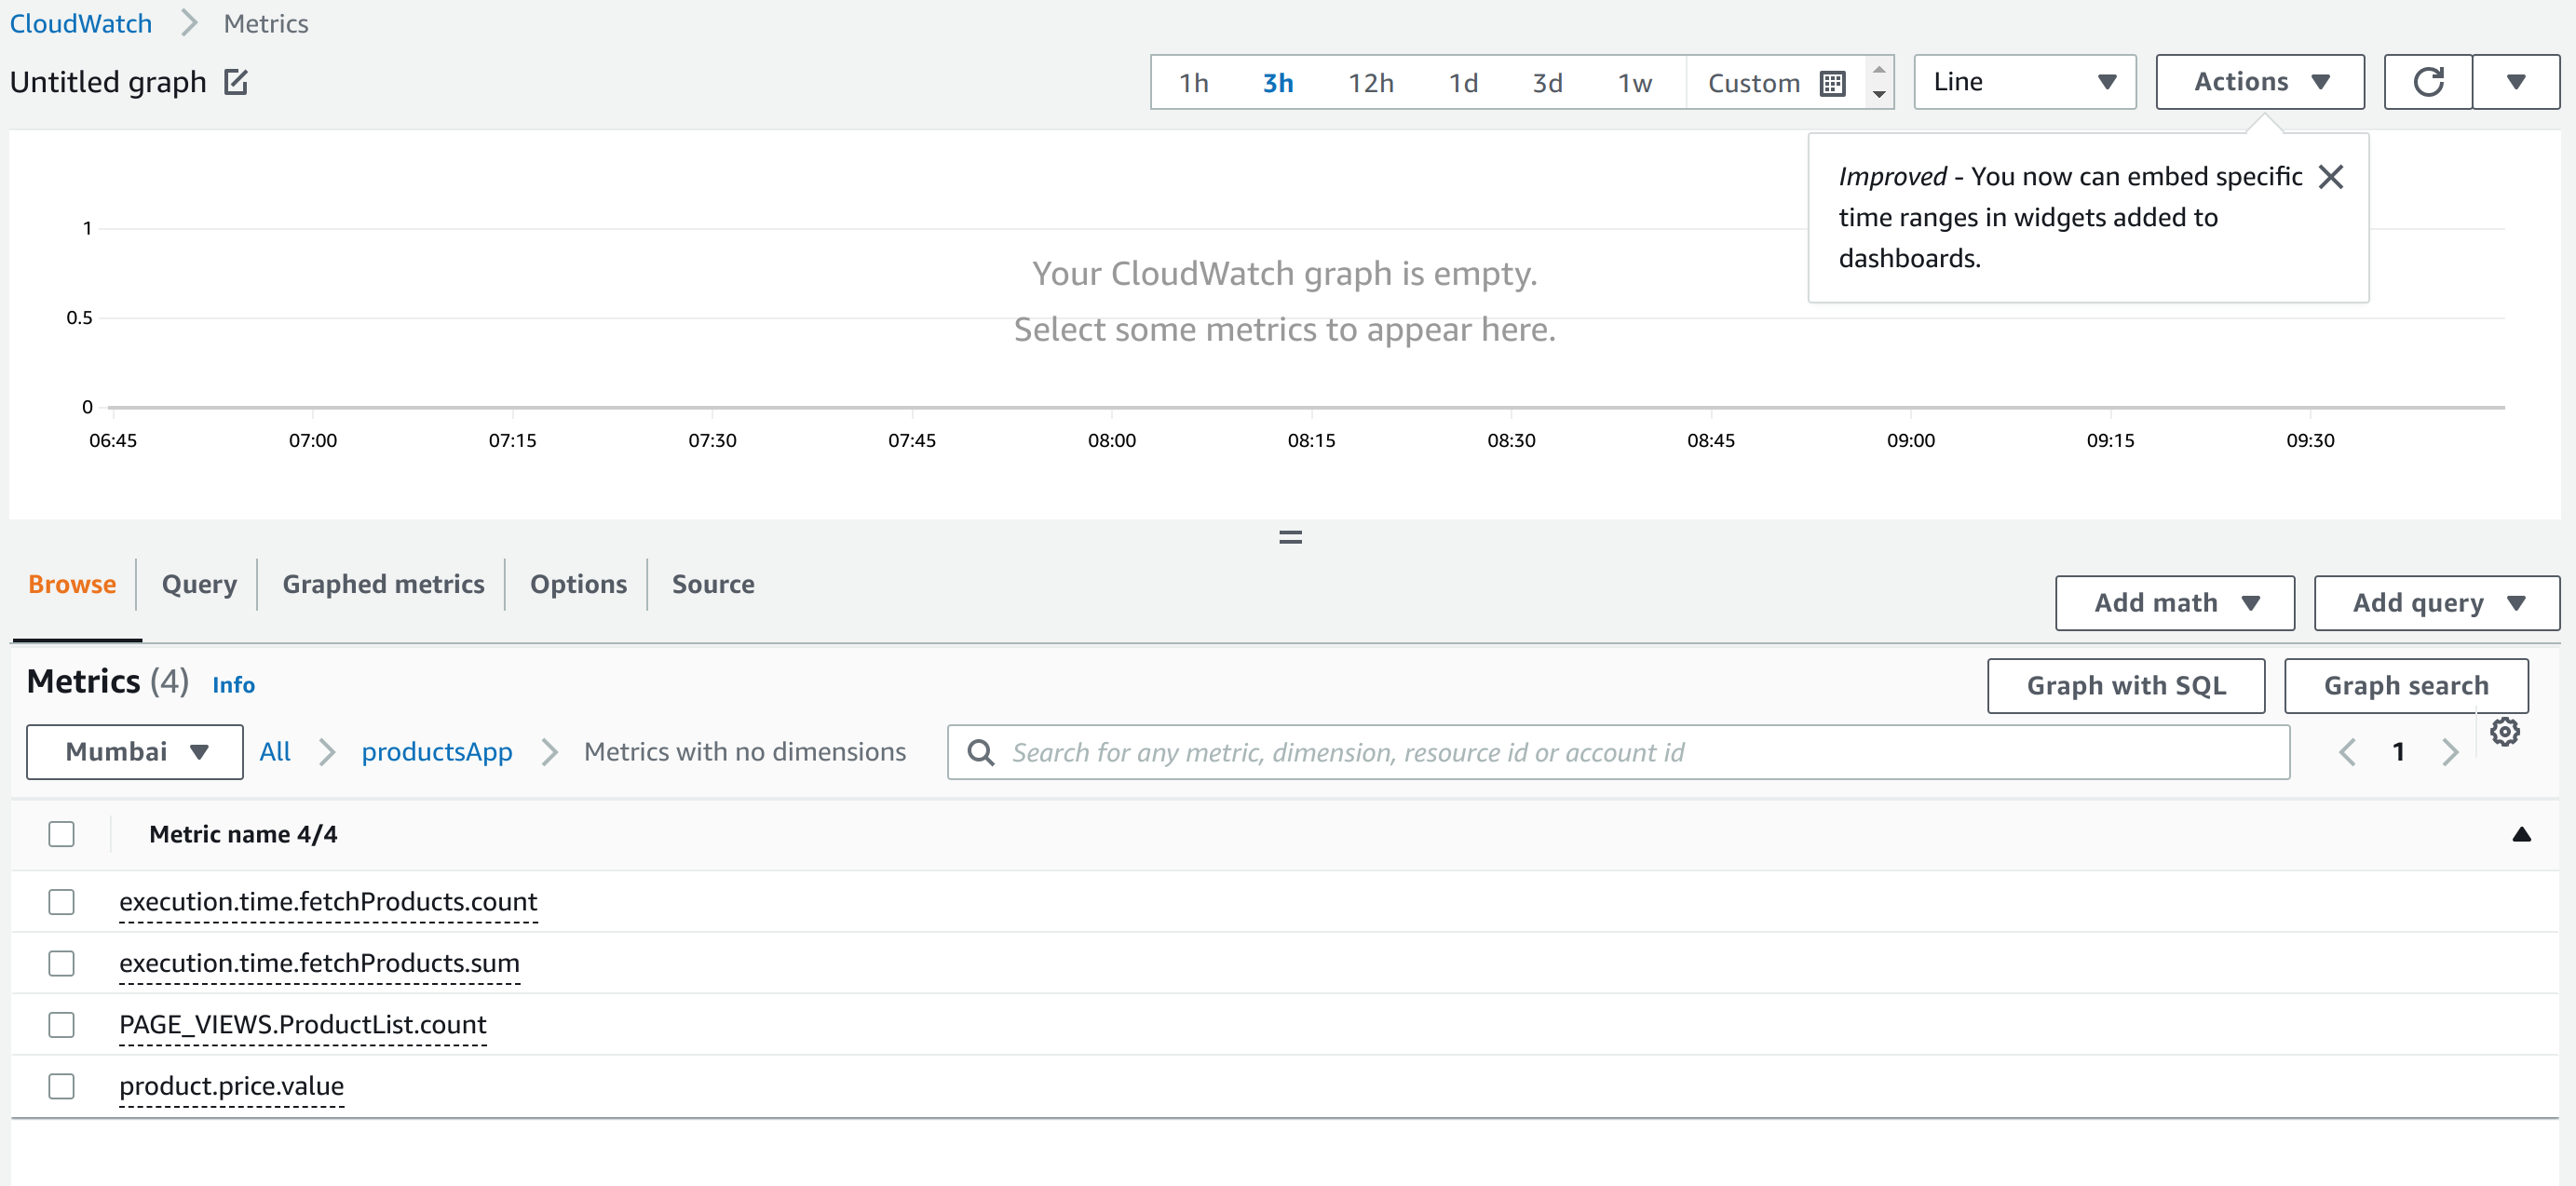
- Navigate to the AWS CloudWatch console and select “Metrics” from the left-hand menu.
- Click on “All Metrics” to view all available metrics for your AWS account.
- Use the search bar to find the metric you want to view by searching for its namespace, metric name, or dimension.
- Once you have found the metric, click on it to expand the metric details.
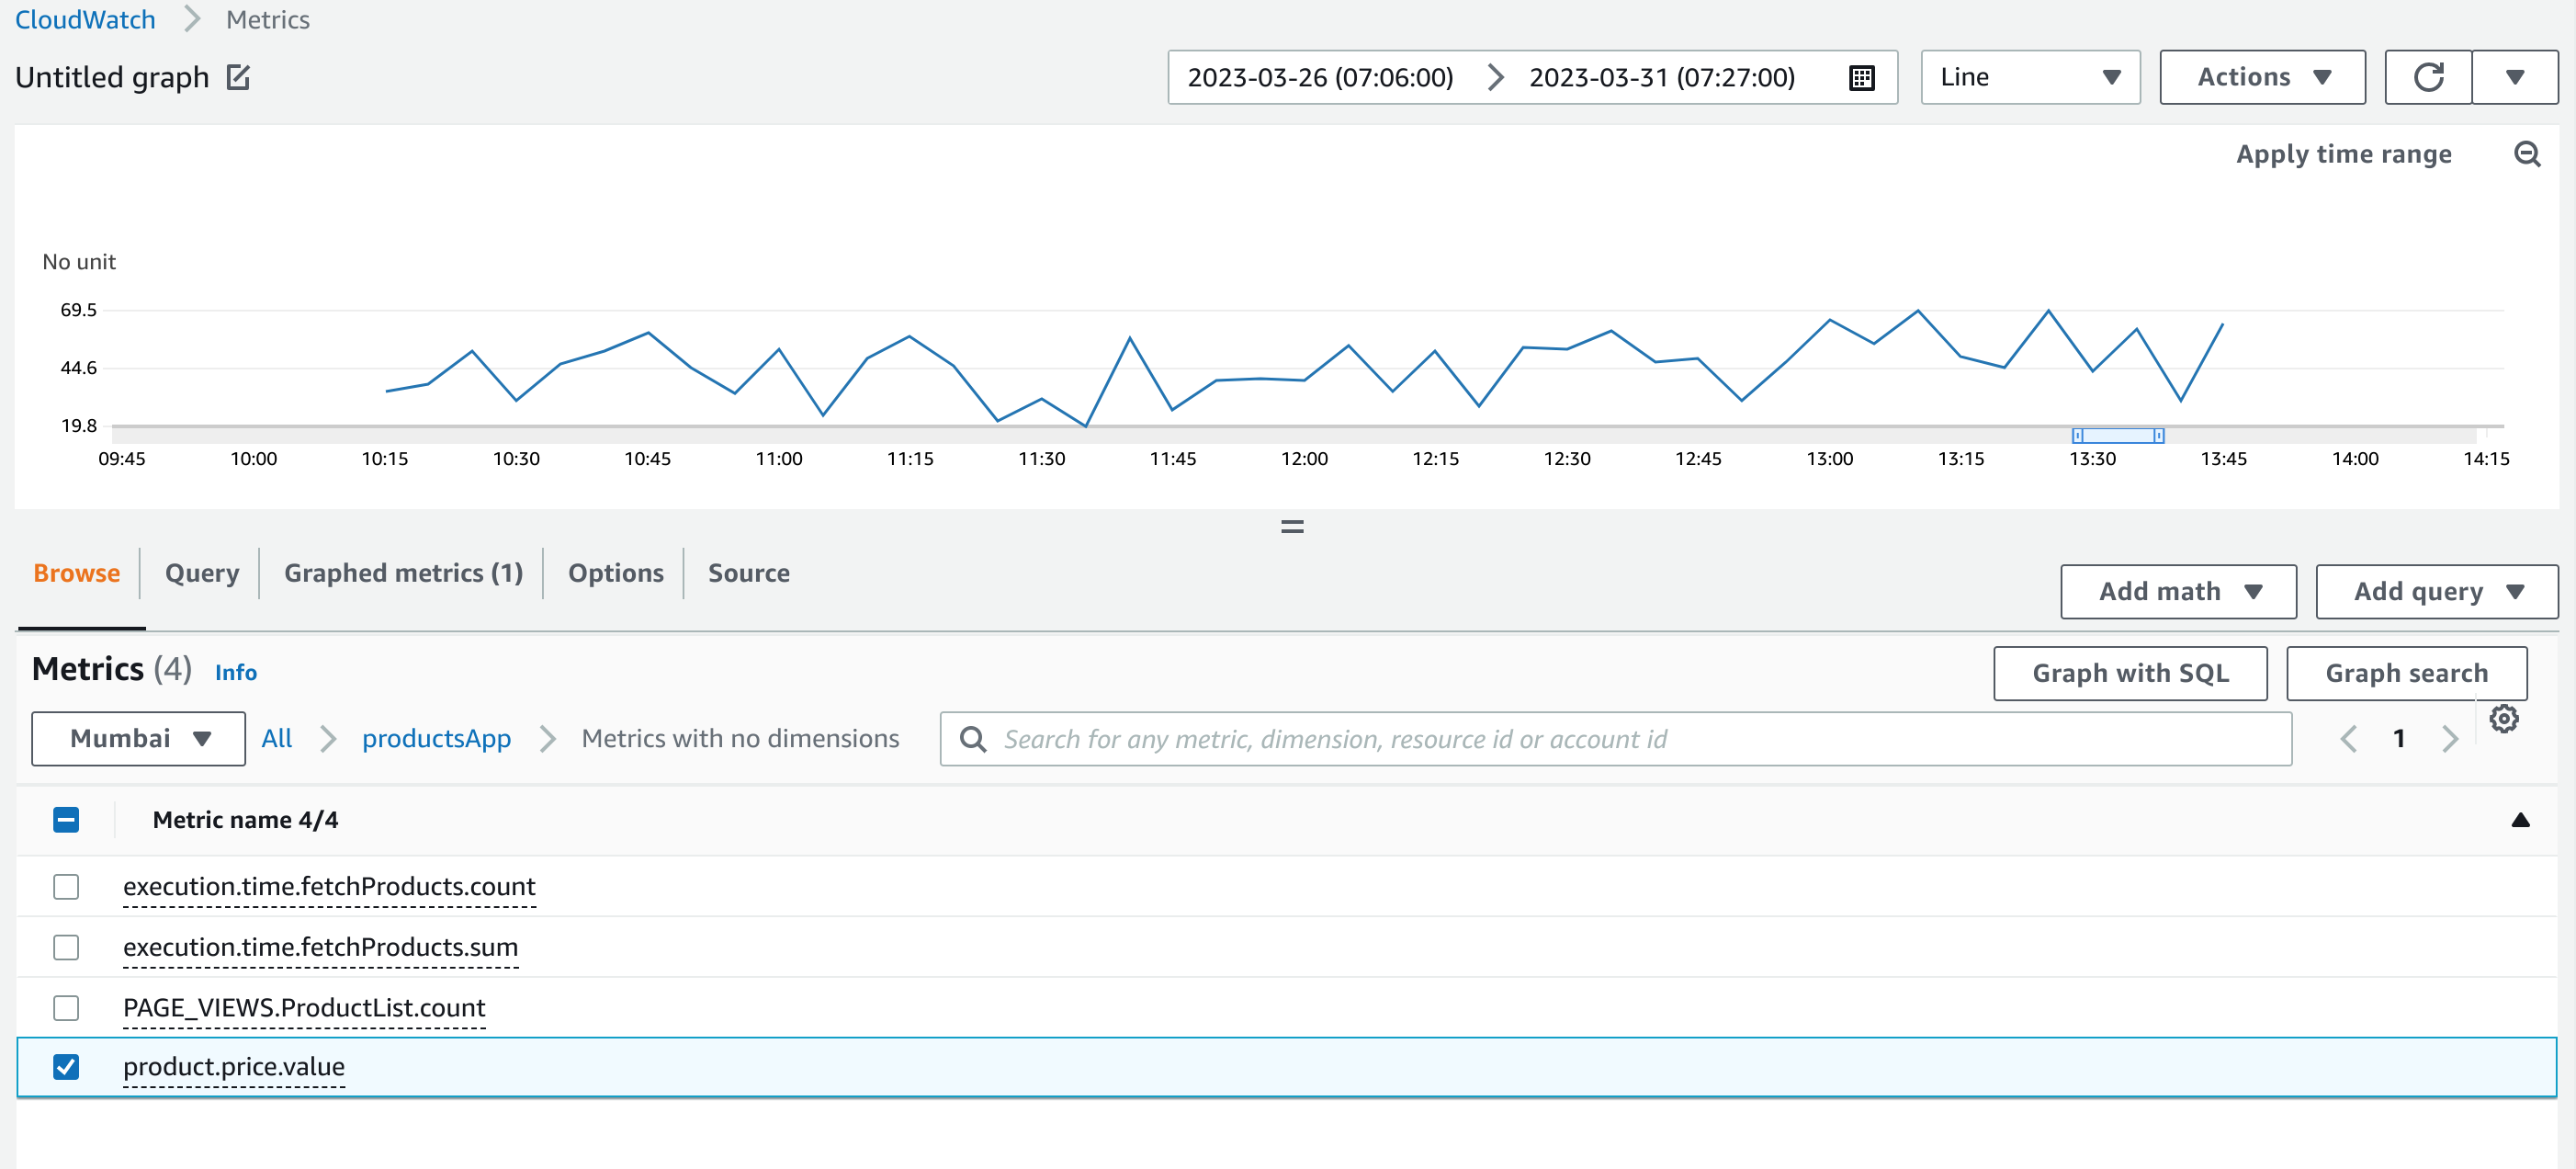
- You can view the metric data in different formats, such as a graph or a table. You can also customize the graph by adding or removing dimensions, changing the time range, or applying different statistical functions.
4. Setting up alarms and notifications
To set up alarms and notifications on AWS CloudWatch, you can follow these steps:
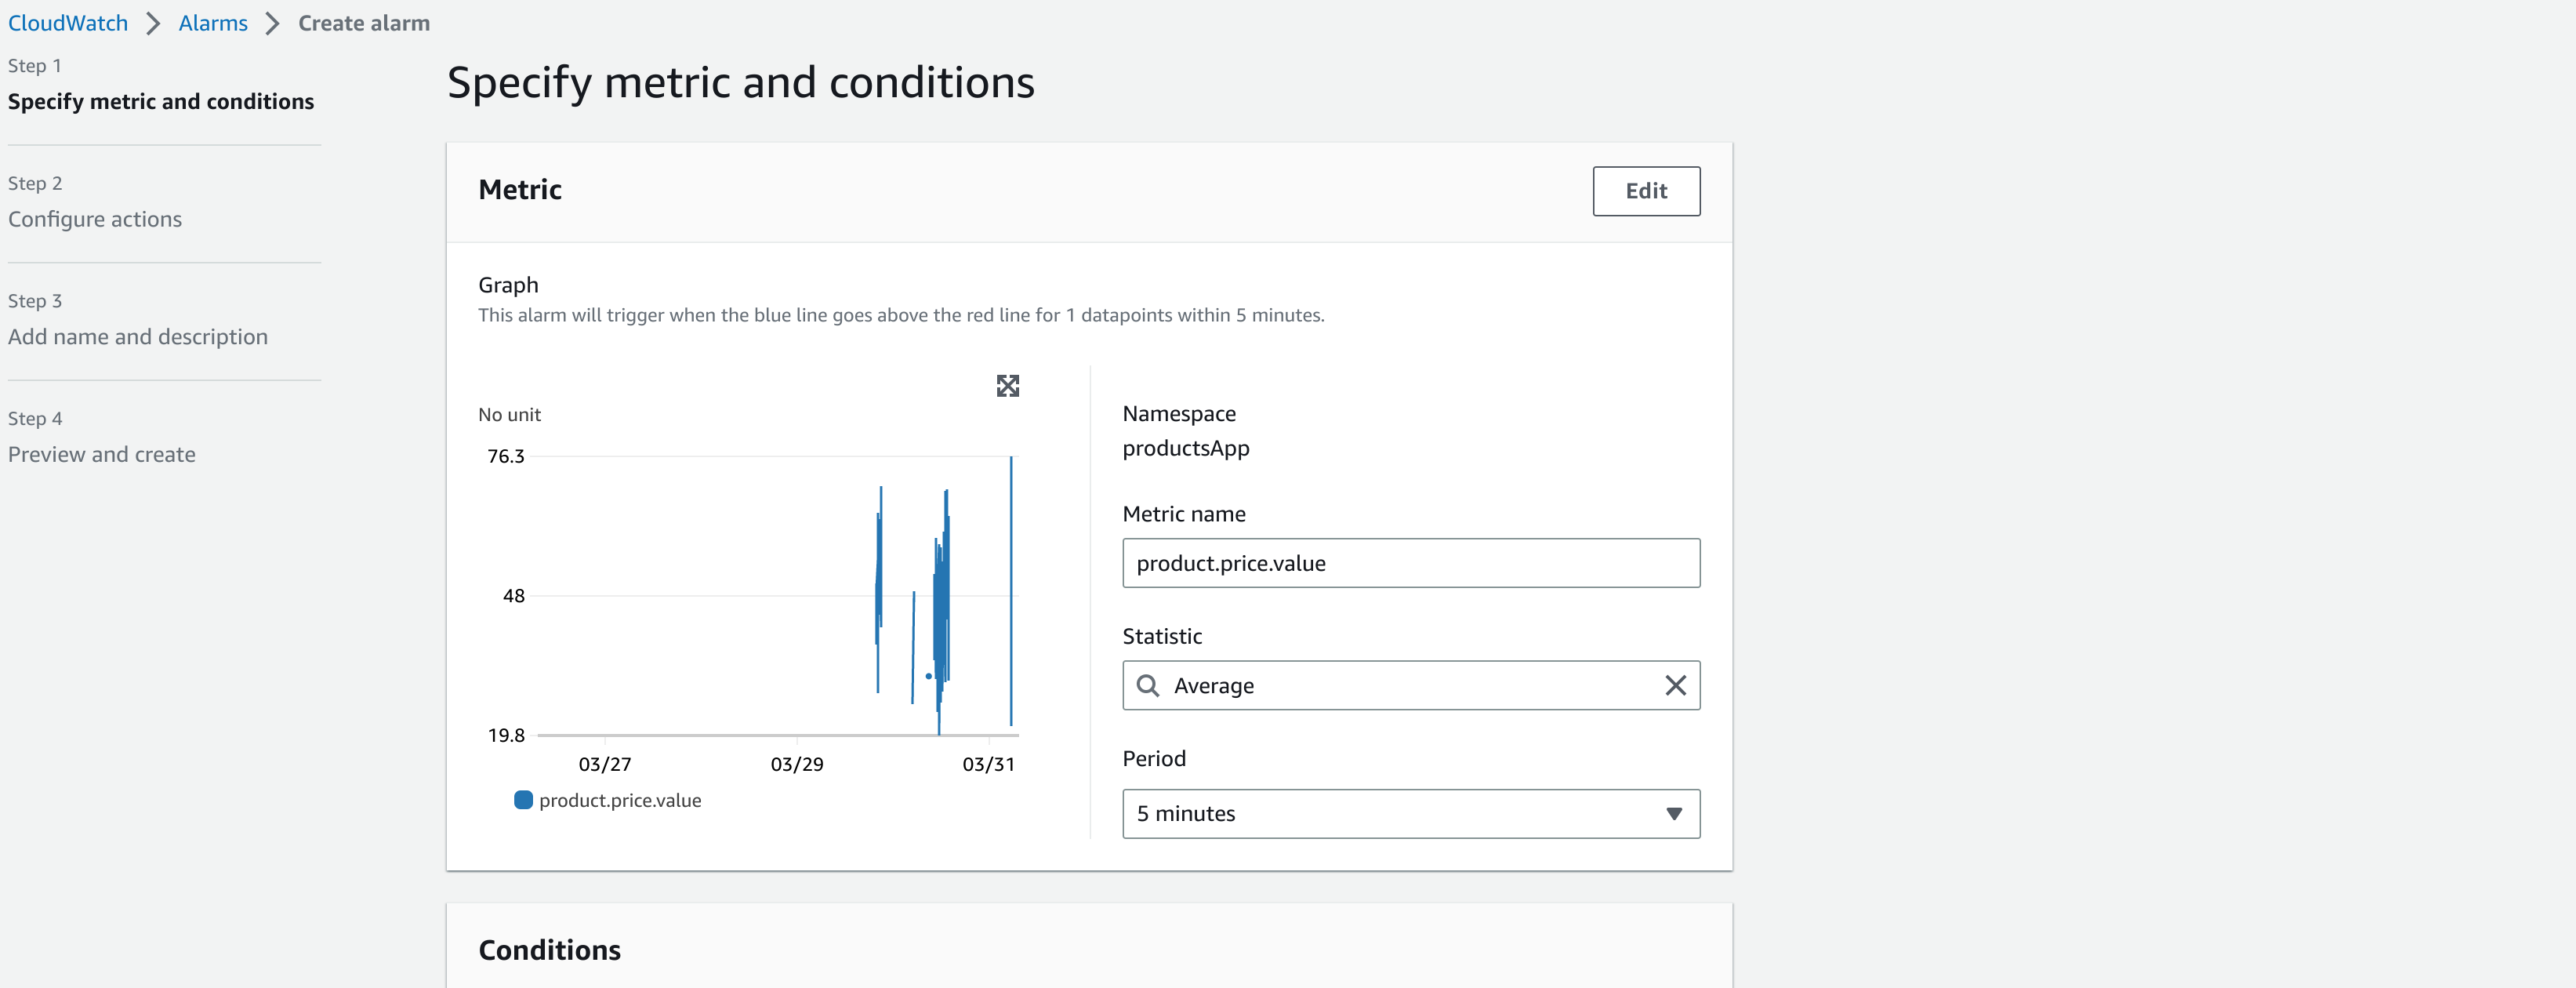
- Navigate to the AWS CloudWatch console and select “Alarms” from the left-hand menu.
- Click on “Create Alarm” to start creating a new alarm.
- Select the metric you want to monitor from the list of available metrics.
- Configure the conditions for the alarm, such as the threshold values and the evaluation period.
- Specify the actions to take when the alarm is triggered, such as sending an email or a text message or invoking an AWS Lambda function.
- Review and confirm the alarm settings, and then create the alarm.
Here are some additional details on each step:
- To create a new alarm, you need to select the metric you want to monitor. You can either select a predefined metric provided by AWS, or create a custom metric based on your own application data.
- Once you have selected the metric, you can configure the conditions for the alarm. For example, you might want to create an alarm that triggers when the CPU utilization of an EC2 instance exceeds 80% for more than 5 minutes.
- You can specify the threshold values and the evaluation period for the alarm. The evaluation period is the time period over which CloudWatch evaluates the metric data to determine if the alarm condition is met.
- You can also specify the actions to take when the alarm is triggered. You can send an email or a text message to one or more recipients, or invoke an AWS Lambda function to perform custom actions.
- Once you have configured the alarm settings, you can review and confirm the settings before creating the alarm.
CloudWatch supports a wide range of notifications and actions, including sending notifications to Amazon SNS topics, invoking AWS Lambda functions, and auto-scaling EC2 instances. With alarms and notifications, you can monitor your AWS resources in real time and respond to any issues before they become critical.
Conclusion
In conclusion, monitoring and observability are critical components of any production system. AWS CloudWatch provides a powerful set of tools for monitoring and collecting metrics, logs, and traces from your AWS resources and applications. With CloudWatch, you can gain visibility into your system’s health and performance, detect issues early, and troubleshoot problems quickly.
In this blog, we have covered the basics of AWS CloudWatch, including metrics, logs, alarms, and notifications. We have explored how to use Cloud Watch to collect and visualize metrics, create custom dashboards, and set up alarms and notifications to alert you to any issues.